Showing posts with label ArcGIS Online. Show all posts

Monday, February 6, 2017

Storymap Highlights Public Works Projects

The City of Rancho Cordova's Public Works Department wanted to showcase to residents the various projects the City was working on. 

Interwest provides GIS Services to the City and was asked to create a map board which depicts various public works projects along with a description, status, a site photo, and funding source(s) for the City's State of the City event in November 2015. 


November 2015 Map Board

The map board was a big success and it was decided that it should be updated annually each year at the State of the City. 

November 2016 Map Board

Knowing this information would work well in a digital format as a story map, in early 2016 a plan was enacted to create a story map with a similar look at feel. A small group of people in the Public Works Department came together to coordinate this project.

The primary goal is to identify some of the many projects managed through the City's Capital Improvement Plan and Community Enhancement Fund (CEF). The application includes projects at various stages of progress from planning through construction and completion as well as ongoing projects, and for each it provides the project name, a brief description, a representative photo, as well as the funding sources, and contact information where you can learn more. 

Story Map 2016

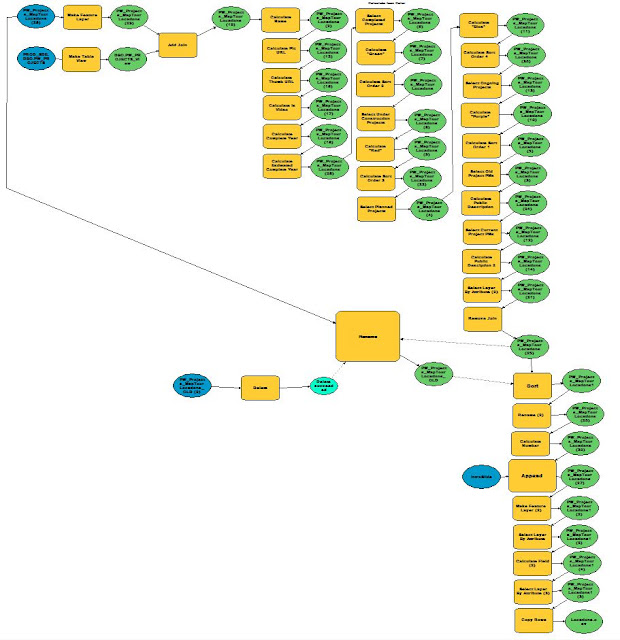
The challenge was to gather all the necessary information on up to 50 projects managed various project managers in the department. In order to do this a MS Excel spreadsheet with all the projects was setup, providing project managers a familiar way to update the details of their projects. This table was linked into MS Access which also made the data available to GIS applications. Once the updates were complete, the GIS staff used model builder to join the table and populate a GIS layer for the tour points which could then simply be exported to a CSV file for easy uploading to ArcGIS Online.

Model Builder

Updates to this application are planned quarterly as time permits (January, April, July, and October) at which time old projects can removed, existing projects can be updated, and new projects can be added. Check it out at: http://arcg.is/2j1wI1Q 


For general questions regarding the projects in this story map please contact Rancho Cordova PublicWorks at (916) 851-8710.

For help, more information, or to report problems with this application please contact Brad Findlay, GIS Analyst at bfindlay@cityofranchocordova.org

Monday, January 30, 2017

Mailing Labels for Owners, Occupants and Neighborhood Groups

The City of Berkeley was in need of a mailing label application that could export lists of addresses based on a buffer around a parcel, point, or line.

The City required mailing labels for the following: 

1. Owners: A query layer was used to combine the two parcel layers into one Owners layer: one for parcels inside the city and one for parcels within a half mile of the city boundary.

2. Occupants: A query layer was used to join the point layer of occupants with the parcel layer to create one parcel layer allowing all occupants of a single parcel to be selected when the parcel is selected.

3. Neighborhood Groups

Interwest utilized Esri's Web AppBuilder to create the application in the City's ArcGIS Online Account.

The users can search for the APN, Situs Address, or Neighborhood Group name.


The search locates and selects the parcel:


The Situation Awareness widget was utilized to provide the buffer and export. Initial the buffer, input the # of feet to buffer around the parcel and the buffer will draw on the map.


Click the Owner, Occupants, or Neighborhood Groups tabs to view the selected parcels and download the csv file.


The tool can also be used to drop a point, draw a line, or draw a polygon to select the owners, occupants, and neighborhood groups. 


Need assistance creating a mailing label application for your agency? Connect with us at: http://www.interwestgrp.com/serv-gis.php 

Thursday, October 27, 2016

Open Data and Agency Collaboration

Interwest was honored to be chosen to speak at the 2016 MISAC Conference in San Diego. 

Below is a link to the slides from the presentation Steve Gay, GISP gave on Open Data and Agency Collaboration on Sun, October 9th.


Need help implementing configuring ArcGIS Open Data for your agency? Contact our GIS Team to find out how we can help your agency meet the open data requirements in Assembly Bill 169 Chapter 737.  

Thursday, September 22, 2016

Croudsource Storymap GIS Game

We had a work retreat last weekend in Monterey, CA. 90 families from our Northern California offices gathered for a fun weekend. Terry, the president of our company, suggested our GIS team make a game for the retreat. (yes, actually, we are hiring ;)

Premise of the Game:
Earn points for sharing photos of your trip via a web app accessible on a smart phone


Our team created 5 different applications and tested them out in the field. The options we evaluated included:

  • WebApp Builder 
  • Public Info AGO Template
  • Find, Edit, Filer AGO Template
  • Citizen Report Web App
  • Crowdsource Storymap

We settled on the Crowdsource Storymap, key reasons included:
  • Intuitive, easy to use
  • ability to login from facebook, google, or ArcGIS Online
  • Gallery feature to easily view other employees' photos


Game Logistics:

  1. Point layer of 15 destinations at the Asilomar Conference Grounds and around Monterey 
  2. A second point layer with 3 hidden destinations
  3. A leaderboard webpage to display
    1. The top 10 point earners
    2. Clues for the 3 hidden stops
    3. Once someone found a hidden stop, display the username and date/time it was found 
    4. Link to launch the game
  4. Employees were set loose with their phones and a link to the leaderboard  
  5. A script ran every 15 minutes to download the crowdsource layer from ArcGIS Online to our SQL Server, give points based on proximity to the 15 destinations or 3 hidden destinations, verify the user did not already get a point for this location, and update a table with each users' point total. 

At the end of the game, we downloaded the photos and shared them at a slideshow during the Saturday evening dinner where the top three point earners won prizes. An extra prize was added for the funniest selfie with Terry!

Our Southern California offices are gathering for a retreat in one week in San Diego. We are working on a new dataset for their retreat and a fun new point scheme!

Check out the Crowdsource Storymap and let us know if we can help create a game for your next team building event! 


Tuesday, May 31, 2016

Using GIS to achieve ADA Title II Self Evaluation & Transition Plan Compliance

Interwest provides GIS services to public agencies to assist with the Americans with Disabilities Act’s (ADA) Title II Self Evaluation and Transition Plan requirements for agencies with 50 or more employees. The goal of this project was to perform a self evaluation of the City of Ceres’ programs, services, and public right-of-way and develop a transition plan for the City to ensure compliance with the ADA.  

ROLE OF GIS


GIS created a tool to assist the City of Ceres in automating the collection and monitoring of facilities and curb ramps.

DATA CREATION

The GIS Team acquired data from Stanislaus County, used existing City data and digitized new data needed to develop basemaps and for running the ranking analysis on the ramps. Our team created a data model to capture physical attributes and images of the ramps, published the data to the City’s ArcGIS Online account, and created web maps to be used for curb ramp collection in Collector for ArcGIS. 

Interwest GIS worked with the City to develop ranking criteria based on location and physical properties identified during collection to assist in mapping the curb ramps by priority. 


FIELD ASSESSMENT

Interwest provided a team of two field personnel who collected images and attributes in Collector on iPad minis. The assessment was completed in three weeks. 

After the field inspection phase was complete, the GIS team worked with engineers implement the ranking criteria. For example, ramps in high traffic locations with excessive slopes or concrete displacement would receive a high priority rank.


MONITORING AND PLANNING 

After all the rankings were determined, Interwest GIS created an overall city map displaying the curb ramps ranking and published it to the City’s ArcGIS Online account for viewing by City staff. 

City staff can use the data and map to monitor, plan, and track improvement of the curb ramps withing the City. 


Need help developing your agency's ADA self evaluation and transition plan? Contact Interwest's GIS Team for more details! 

Tuesday, December 1, 2015

ArcGIS Online Assistant and Service Status Tools


ArcGIS Online Assistant: This link shows the URLs for each of your web maps/apps.  You can alter the URLs, if needed.  https://ago-assistant.esri.com/

Service Status for Organizations:  This links shows which of your web maps/apps have broken links in them.  http://maps.esri.com/AGSJS_Demos/OnlineContent/ServiceStatus/index.html

You will be prompted to login to your ArcGIS Online account.  


Monday, May 11, 2015

Weed Abatement for Fire Prevention Using GIS

Every year the City of Merced's Fire Department conducts a weed abatement survey to identify and locate areas where weed over-growth can cause a potential fire hazard.  

Residents are required to maintain their properties year round by removing weeds as well as other combustible debris such as junk wood, dead trees, and dead brush. Adherence to the ordinance is critical during the dry season.

Interwest partnered with the City’s GIS department to quickly develop a web based inspection application to help track all the information tied to the weed abatement survey. 

Read more here: http://www.mercedsunstar.com/news/local/article3259195.html#storylink=cpy


The GIS application helped the city gather the information in just a few weeks, allowing staff to analyze the data and work with citizens on mitigating the potential fire hazards.

Interested in having Interwest's GIS Solutions team create a web application for your agency?  Contact the GIS Team to get started. 

Thursday, May 7, 2015

Drought Response and Water Conservation with GIS

The City of Elk Grove's citizens are served by multiple water purveyors. Each agency is responsible for determining rationing and restrictions of its customers as California faces the most severe drought in recorded history. The City created a web page to help citizens determine which agency services their home and their home's permitted watering days and times. 

Interwest's GIS team assisted this effort by creating a web map for citizens to determine which agency services their home.


In addition to the webmap, Interwest created a widget for the webpage that allows a citizen to look up their address and determine their watering restrictions. Addresses auto-fill as the citizen types, the citizen selects the appropriate address and searches.


The widget accesses the rest end point of the ArcGIS Online hosted feature service to display restrictions based on the water purveyor servicing that address and the even/odd address number of the parcel.


Interested in having Interwest's GIS Solutions team assist with your agency's drought response efforts?  Contact the GIS Team to get started. 


CSD Demonstrates Storm Water Compliance Using GIS

Cosumnes Community Services District (CSD) needed to create an inventory of drainage inlets to meet California State Water Control Board storm sewer system requirements.

Interwest acquired data, created map products, and a custom webpage to view and edit the data:


  • Data exports acquired from the City of Elk Grove
  • Web map of inlets, pipelines, and outfalls in or near the CSD’s parks and fire stations
  • Field inspections to add inlets within the District’s parks
  • Custom webpage to display the inlet details and images


The data creation process included starting with the infrastructure provided by the City of Elk Grove, removing inlets, pipeline and outfalls that were not connected to CSD’s parks or firestation, adding new inlets that were within CSD’s properties, and mapping them to their appropriate outfall. Field inspections were conducted using Collector for ArcGIS to add inlets and their related details and photos.


The District is able to demonstrate the flow of storm water from inlet to outfall to the California State Water Control Board for each of their properties, track inspection date, watershed area, ownership information and images to assist with state requirements as well as maintenance efforts. 

The webpage allows staff to edit live data from the rest end point of the hosted feature class; any changes to the inlets on the webpage are available immediately on the map in ArcGIS Online or Collector for ArcGIS. 


Interested in having Interwest's GIS Solutions team assist with your agency's State Water Control Board requirements?  Contact the GIS Team to get started.

Monday, April 13, 2015

LED Retrofit Utilizes ArcGIS Platform

Interwest provides GIS services to local government agencies to assist in field collection and citizen communication. The goal of this project was to provide field collection tools for staff converting streetlights to LED and a communication tool to share the progress with citizens in the City of Elk Grove.  The City was already using ArcGIS Online as a platform to collaborate with GIS and other data so this tool was the natural solution to support the LED retrofit.

FIELD INSPECTIONS 

To ensure accurate cost estimates an inventory of all lights was conducted using Collector for ArcGIS.  Missing lights were added, retired lights were removed and the description of light types was updated.  This data was exported for inclusion in the Request For Proposals.  Once the project was under way the installation contractor also utilized Collector to track the date each light was modified.  The view of the data for field crews was limited to just the attributes they needed to modify. 


COMMUNICATION

Project mangers were able to review the data for lights as they were replaced. They could inspect and accept each light as appropriate.  A very streamlined webmap application was created to show the public the status of lights as they were completed.   


KEY BENEFITS

Ease of use  -  Installation crews received one hour of  introductory training.  They modified GIS data for over 10,000 streetlights and did not request technical assistance at all throughout the process.

Up-to-the-minute data – Utilizing a platform that is accessible to all stakeholders allowed the data being captured in the field to be accessible to project mangers and citizens immediately.  
Centrally tracked data eliminated the situation of data inconsistency that often occurs when multiple copies of data is stored.
A grid showing the scheduled dates for installation showed citizens when to expect work in their neighborhood. The exact installation status of each light displayed the specific progress on each street.
The billing process was very efficient enabling staff to authorize payment on exactly the lights that were installed – per the vendors field data entry.

Speed of system deployment - A sample version of the database was created and accessible to the field crews in less than a week.
Most changes that were requested during the project were able to be accomplished immediately with no disruption to the field crews workflow.

BEFORE & AFTER
Images available on the City's website.

Wednesday, December 10, 2014

Empowering Citizens' Emergency Preparedness with GIS

Interwest's GIS team created an interactive webmap to allow the citizens of Elk Grove to quickly locate the nearest open location to pick-up sandbags, enabling citizens to be prepared for the upcoming storm.  The map is embedded in the City's website at this link.


Thursday, November 20, 2014

Utilizing GIS for Event Planning and Permit Review

The City of Elk Grove’s Community Event and Project Coordinator requested a series of printed maps for each of the City’s community events.  She used the maps to make event layouts for vendors, parking, first aid, and security.  For events hosted by a citizen, she passed the printed maps along to the event coordinator who would mark them up and submit plans for an event permit.  The marked up paper maps were then given back to Interwest GIS staff to create a final event map.

Intewest’s GIS team streamlined this paper process by creating an ArcGIS Online map template for event coordination and trained staff to use the template to make web maps for each event.  The City’s event coordinator is now able to create her own event mark ups of any area of the city.


The City also provides this tool to the public to submit event plans without needing to setup meetings and provide revisions.  The City’s event coordinator and the citizen are now able to set up conference calls and edit the web map markups in real time.

The City’s event coordinator reported that the new resource will efficiently communicate logistical information across multiple departments and will be extremely useful in reviewing plans with community event organizers and planning our own City events.

Interested in having Interwest's GIS Solutions team create streamlined GIS solutions for your organization?  Contact the GIS Team to get started.

Monday, October 6, 2014

Rental Inspection Field Collection with GIS

Interwest's GIS Team worked with the The City of Covina to conduct an initial cursory review from the public right of way of over 1300 properties registered in the Rental Housing Inspection Program. The City was looking for violations of city and community standards. Interwest’s field inspectors collected data and took photographs with iPads. The field collection directly uploaded into a customized tracking system compatible with the City’s current GIS system.


Interwest’s field collection staff utilized the Collector app to record their findings and ArcGIS Online web maps were created to provide a visual representation of the field collection work so City staff could monitor the progress and analyze the outcomes of the rental inspections.


Interwest worked with the City to develop a community based program for sustaining rental housing standards. The City of Covina received a Helen Putnam Award for Excellence in Internal Administration for the innovative solution.

After the field inspection, Interwest worked with the City's GIS Technician James Knox, to migrate the data and web maps from Interwest's ArcGIS Server to the City's on premise ArcGIS Server.


Steve Gay, James Knox, and Mark Dumford

Interested in having Interwest's GIS Solutions team design and implement a rental inspection program for your organization?  Contact the GIS Team to get started.


Sunday, November 11, 2012

Join Us: ArcGIS Online Presentation Nov 27th

Join us for the Sacramento User Group on November 27th -  Interwest Consulting Group is doing a presentation on ArcGIS Online.  More details about this and other presentations can be found on the Sacramento Area GIS User Group Blog:


For more information contact:

Bob Earle

(916) 798-8174

bearle@interwestgrp.com