Showing posts with label livable communities. Show all posts

Monday, March 27, 2017

Regulatory Street Sign Inventory

The City of St. Helena needed to conduct a regulatory street sign inventory to comply with recent changes to the California Manual on Uniform Traffic Control Devices (MUTCD) standards for retroreflectivity. 

The City had previously conducted a paper survey of approximately 1/3 of the regulatory street signs. Interwest GIS created a GIS layer using the paper surveys and Google Street view to identify the locations of regulatory signs.

Interwest GIS utilized Collector of ArcGIS during over two days in the field to verify the location and capture data for the City's 609 regulatory signs:
  • MUTCD code
  • sign condition
  • whether the signs met retroreflectivity standards
  • post material
  • sign size
  • sign direction
  • sign text
  • and capture photos of signs that did not meet retroreflectivity standards

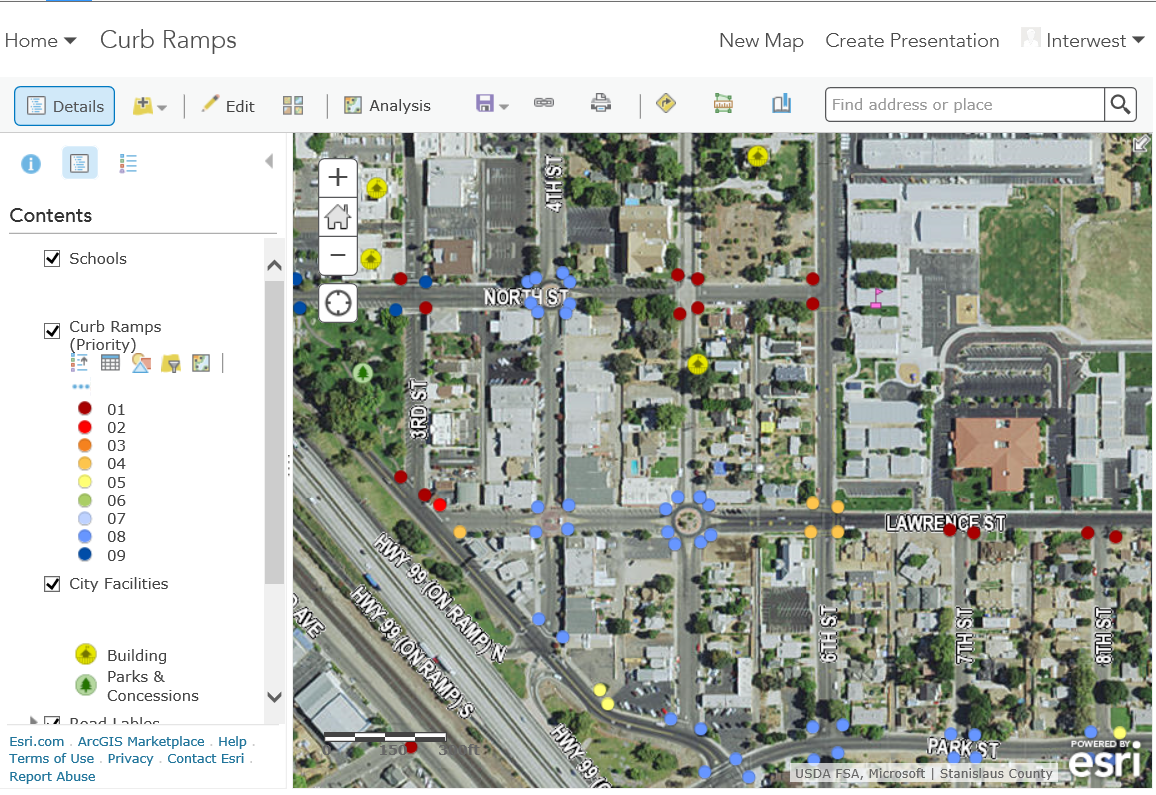
The City now has an accurate and detailed regulatory street sign GIS layer that they can use to prioritize the replacement of street signs that don't meet retroreflectivity standards or are in poor condition.

A related table was created for maintenance tracking. Collector is used in the field to update each sign's condition, date maintenance was performed, etc.

Web maps can be used to view locations and types of signs as well as condition so maintenance expenses can be planned over multiple fiscal years. 


Need help with the setup and/or collection of a street sign inventory? Contact Interwest GIS at: http://www.interwestgrp.com/serv-gis.php  

Tuesday, May 31, 2016

Using GIS to achieve ADA Title II Self Evaluation & Transition Plan Compliance

Interwest provides GIS services to public agencies to assist with the Americans with Disabilities Act’s (ADA) Title II Self Evaluation and Transition Plan requirements for agencies with 50 or more employees. The goal of this project was to perform a self evaluation of the City of Ceres’ programs, services, and public right-of-way and develop a transition plan for the City to ensure compliance with the ADA.  

ROLE OF GIS


GIS created a tool to assist the City of Ceres in automating the collection and monitoring of facilities and curb ramps.

DATA CREATION

The GIS Team acquired data from Stanislaus County, used existing City data and digitized new data needed to develop basemaps and for running the ranking analysis on the ramps. Our team created a data model to capture physical attributes and images of the ramps, published the data to the City’s ArcGIS Online account, and created web maps to be used for curb ramp collection in Collector for ArcGIS. 

Interwest GIS worked with the City to develop ranking criteria based on location and physical properties identified during collection to assist in mapping the curb ramps by priority. 


FIELD ASSESSMENT

Interwest provided a team of two field personnel who collected images and attributes in Collector on iPad minis. The assessment was completed in three weeks. 

After the field inspection phase was complete, the GIS team worked with engineers implement the ranking criteria. For example, ramps in high traffic locations with excessive slopes or concrete displacement would receive a high priority rank.


MONITORING AND PLANNING 

After all the rankings were determined, Interwest GIS created an overall city map displaying the curb ramps ranking and published it to the City’s ArcGIS Online account for viewing by City staff. 

City staff can use the data and map to monitor, plan, and track improvement of the curb ramps withing the City. 


Need help developing your agency's ADA self evaluation and transition plan? Contact Interwest's GIS Team for more details! 

Thursday, May 7, 2015

CSD Demonstrates Storm Water Compliance Using GIS

Cosumnes Community Services District (CSD) needed to create an inventory of drainage inlets to meet California State Water Control Board storm sewer system requirements.

Interwest acquired data, created map products, and a custom webpage to view and edit the data:


  • Data exports acquired from the City of Elk Grove
  • Web map of inlets, pipelines, and outfalls in or near the CSD’s parks and fire stations
  • Field inspections to add inlets within the District’s parks
  • Custom webpage to display the inlet details and images


The data creation process included starting with the infrastructure provided by the City of Elk Grove, removing inlets, pipeline and outfalls that were not connected to CSD’s parks or firestation, adding new inlets that were within CSD’s properties, and mapping them to their appropriate outfall. Field inspections were conducted using Collector for ArcGIS to add inlets and their related details and photos.


The District is able to demonstrate the flow of storm water from inlet to outfall to the California State Water Control Board for each of their properties, track inspection date, watershed area, ownership information and images to assist with state requirements as well as maintenance efforts. 

The webpage allows staff to edit live data from the rest end point of the hosted feature class; any changes to the inlets on the webpage are available immediately on the map in ArcGIS Online or Collector for ArcGIS. 


Interested in having Interwest's GIS Solutions team assist with your agency's State Water Control Board requirements?  Contact the GIS Team to get started.

Monday, April 13, 2015

LED Retrofit Utilizes ArcGIS Platform

Interwest provides GIS services to local government agencies to assist in field collection and citizen communication. The goal of this project was to provide field collection tools for staff converting streetlights to LED and a communication tool to share the progress with citizens in the City of Elk Grove.  The City was already using ArcGIS Online as a platform to collaborate with GIS and other data so this tool was the natural solution to support the LED retrofit.

FIELD INSPECTIONS 

To ensure accurate cost estimates an inventory of all lights was conducted using Collector for ArcGIS.  Missing lights were added, retired lights were removed and the description of light types was updated.  This data was exported for inclusion in the Request For Proposals.  Once the project was under way the installation contractor also utilized Collector to track the date each light was modified.  The view of the data for field crews was limited to just the attributes they needed to modify. 


COMMUNICATION

Project mangers were able to review the data for lights as they were replaced. They could inspect and accept each light as appropriate.  A very streamlined webmap application was created to show the public the status of lights as they were completed.   


KEY BENEFITS

Ease of use  -  Installation crews received one hour of  introductory training.  They modified GIS data for over 10,000 streetlights and did not request technical assistance at all throughout the process.

Up-to-the-minute data – Utilizing a platform that is accessible to all stakeholders allowed the data being captured in the field to be accessible to project mangers and citizens immediately.  
Centrally tracked data eliminated the situation of data inconsistency that often occurs when multiple copies of data is stored.
A grid showing the scheduled dates for installation showed citizens when to expect work in their neighborhood. The exact installation status of each light displayed the specific progress on each street.
The billing process was very efficient enabling staff to authorize payment on exactly the lights that were installed – per the vendors field data entry.

Speed of system deployment - A sample version of the database was created and accessible to the field crews in less than a week.
Most changes that were requested during the project were able to be accomplished immediately with no disruption to the field crews workflow.

BEFORE & AFTER
Images available on the City's website.

Thursday, February 14, 2013

GIS ADA Compliance Curb Ramp Project


Interwest’s GIS Team created an ArcGIS Online application that was used in the field to collect individual curb ramp location attribute information.  The goal of the project was to create an improvement plan for the City of Bell to repair curb ramps over several fiscal years depending on priority. The plan was used to help the city with its Americans with Disabilities Act (ADA) Compliance efforts.

The GIS team met with City of Bell staff to determine a list of attributes required for the project, created a shell geodatabase with these attributes in ArcGIS Server to facilitate direct live edits into the city production data set, and brought the geodatabases together with aerial photos provided by Esri’s Bing Basemaps.  The GIS team systematically reviewed the entire city, creating a point location for each curb ramp, then created an ArcGIS Online application to be used in the field for data collection.


A field inspector visited each location and updated the condition of the curb ramps using ArcGIS Online on a 3G enabled Apple iPad.  These updates were available in real time to GIS staff at the office.

After the data collection phase was complete, the GIS team worked with project engineers to determine location priorities such as high traffic areas and physical condition of the curb ramp. After all the priorities were determined a Map Series was made to display these priorities and create an improvement plan across several fiscal years.


The data was brought into ArcMap to create maps for a public meeting to showcase the city's plans for future ramp improvements.  An ADA Transition plan was created for each fiscal year; additional maps were created to show the public the plans for the current year.


Contact us today to find out how Interwest Consulting Group's GIS Team can help your public agency use GIS in your ADA Compliance efforts.