Monday, July 1, 2019

Story Map Highlights City-Wide Projects


The City of Burlingame wanted to share with residents information on projects underway around the city.

Our team at Interwest GIS created a public-facing story map for the City of Burlingame website, which highlights various projects throughout the city from Community Development, Parks and Recreation, and Public Works.


Each department is responsible for updating their own content by way of an ArcGIS Online WebApp that each city department has access to. Project data gets created and updated via this editing application, where project boundaries, attributes, and images are entered. 


The public-facing story map then gets updated nightly through a series of Python scripts. The scripts also automatically handle retiring completed projects from the story map after a specified number of days as well as any projects with missing information (ie - missing photos). 


The story map provides users with project details, contact information, and links for additional information. Additionally, detailed map symbology provides users with a quick reference regarding a project’s status as well as the department overseeing the project. 


Due to the high level of automation behind the scenes, minimal effort is required from city staff to maintain the story map allowing residents to be informed and aware of the latest city-related projects in their neighborhoods.  

View this story map here.

Need assistance creating a similar project? Contact Interwest GIS for more information. 

Monday, June 5, 2017

Crime Viewer

The City of Rancho Palos Verdes wanted to provide a crime viewer tool for the public to access both current and historical crime data.

Interwest GIS created a GIS Viewer using Latitude Geographics Geocortex software. Our team created automated routines to download the data from the County's website, import it into the GIS database, and created query layers to merge specific crime codes into broader categories.


The GIS Viewer displays the crime by year and by type allowing citizens to turn on and off layers to focus on the specific types of crime and date range that concerns them.

The public can download the crime data to a csv file if desired and utilize the time slider tool to view the crime in their area chronologically.


The Crime Viewer also has a comprehensive report where the public can view where crime has increased or decreased by category from 2005 - present.

Need assistance created a crime viewer for your citizens? Contact Interwest GIS to discuss your project. 


Fire Run Book

The City of Vacaville Fire Department contacted Interwest GIS to request an update to their fire run book. 


For this project, Interwest GIS was tasked with creating a new updated version of the City’s Fire Run Books. The city had some base layers and additional data layers were created by Interwest. New or updated layers included: 

  • hydrants
  • fire grid index
  • emergency vehicle access points and routes
  • master address database points
  • water points and lines
  • schools
  • apartments/condos
  • commercial areas
  • industrial areas
  • manufactured parks
  • hospitals 

Using ArcGIS Pro for data editing and ArcMap 10.3 Data Driven Pages, Interwest GIS created a new modern rendition of the City's fire run books. The new and updated data feeding into the run books will serve other uses within the City’s Enterprise GIS System.


Need assistance with fire run map book creation? Contract Interwest GIS to let us know how we can help. 

Operations Dashboard showcasing New Construction Permits

Interwest GIS implemented the Operations Dashboard for the City of Elk Grove to display building permit data. Our team had been creating monthly pdf maps for the City's Building Department and felt the dashboard would be a meaningful way to display both an interactive map and graphs showing the number of residential and commercial permits per month.


A model was created to join the permit data to the parcel data to display in the map and graphs.

In addition to giving a snapshot overview of permit activity, the interactive map allows citizens and staff to click on area and get more information about the permit.

An Operations Dashboard is a great way to display graphs and maps to monitor activities such as building permits or maintenance requests. Need help implementing Operations Dashboard for ArcGIS? Contact Interwest GIS for more information.

Creating our Public Works Story

Check out Brad's presentation from the April 2017 Sacramento GIS User Group on creating a CIP Storymap for the City of Rancho Cordova.


Monday, March 27, 2017

Regulatory Street Sign Inventory

The City of St. Helena needed to conduct a regulatory street sign inventory to comply with recent changes to the California Manual on Uniform Traffic Control Devices (MUTCD) standards for retroreflectivity. 

The City had previously conducted a paper survey of approximately 1/3 of the regulatory street signs. Interwest GIS created a GIS layer using the paper surveys and Google Street view to identify the locations of regulatory signs.

Interwest GIS utilized Collector of ArcGIS during over two days in the field to verify the location and capture data for the City's 609 regulatory signs:
  • MUTCD code
  • sign condition
  • whether the signs met retroreflectivity standards
  • post material
  • sign size
  • sign direction
  • sign text
  • and capture photos of signs that did not meet retroreflectivity standards

The City now has an accurate and detailed regulatory street sign GIS layer that they can use to prioritize the replacement of street signs that don't meet retroreflectivity standards or are in poor condition.

A related table was created for maintenance tracking. Collector is used in the field to update each sign's condition, date maintenance was performed, etc.

Web maps can be used to view locations and types of signs as well as condition so maintenance expenses can be planned over multiple fiscal years. 


Need help with the setup and/or collection of a street sign inventory? Contact Interwest GIS at: http://www.interwestgrp.com/serv-gis.php  

Monday, February 6, 2017

Storymap Highlights Public Works Projects

The City of Rancho Cordova's Public Works Department wanted to showcase to residents the various projects the City was working on. 

Interwest provides GIS Services to the City and was asked to create a map board which depicts various public works projects along with a description, status, a site photo, and funding source(s) for the City's State of the City event in November 2015. 


November 2015 Map Board

The map board was a big success and it was decided that it should be updated annually each year at the State of the City. 

November 2016 Map Board

Knowing this information would work well in a digital format as a story map, in early 2016 a plan was enacted to create a story map with a similar look at feel. A small group of people in the Public Works Department came together to coordinate this project.

The primary goal is to identify some of the many projects managed through the City's Capital Improvement Plan and Community Enhancement Fund (CEF). The application includes projects at various stages of progress from planning through construction and completion as well as ongoing projects, and for each it provides the project name, a brief description, a representative photo, as well as the funding sources, and contact information where you can learn more. 

Story Map 2016

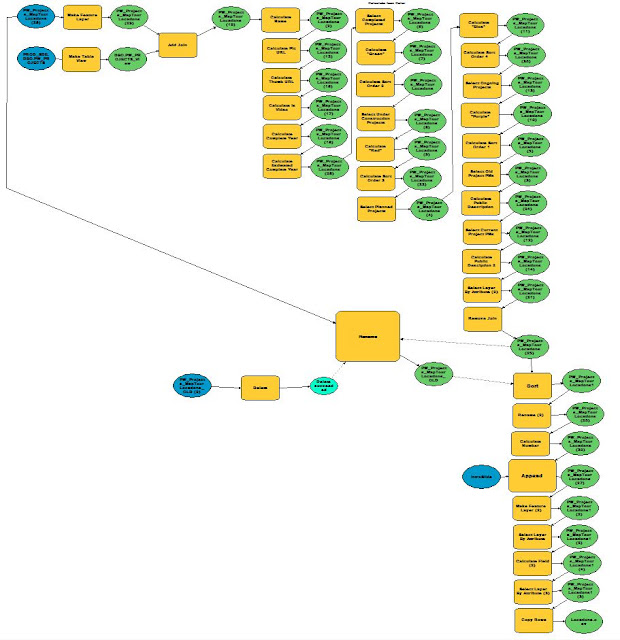
The challenge was to gather all the necessary information on up to 50 projects managed various project managers in the department. In order to do this a MS Excel spreadsheet with all the projects was setup, providing project managers a familiar way to update the details of their projects. This table was linked into MS Access which also made the data available to GIS applications. Once the updates were complete, the GIS staff used model builder to join the table and populate a GIS layer for the tour points which could then simply be exported to a CSV file for easy uploading to ArcGIS Online.

Model Builder

Updates to this application are planned quarterly as time permits (January, April, July, and October) at which time old projects can removed, existing projects can be updated, and new projects can be added. Check it out at: http://arcg.is/2j1wI1Q 


For general questions regarding the projects in this story map please contact Rancho Cordova PublicWorks at (916) 851-8710.

For help, more information, or to report problems with this application please contact Brad Findlay, GIS Analyst at bfindlay@cityofranchocordova.org