Monday, March 27, 2017

Regulatory Street Sign Inventory

The City of St. Helena needed to conduct a regulatory street sign inventory to comply with recent changes to the California Manual on Uniform Traffic Control Devices (MUTCD) standards for retroreflectivity. 

The City had previously conducted a paper survey of approximately 1/3 of the regulatory street signs. Interwest GIS created a GIS layer using the paper surveys and Google Street view to identify the locations of regulatory signs.

Interwest GIS utilized Collector of ArcGIS during over two days in the field to verify the location and capture data for the City's 609 regulatory signs:
  • MUTCD code
  • sign condition
  • whether the signs met retroreflectivity standards
  • post material
  • sign size
  • sign direction
  • sign text
  • and capture photos of signs that did not meet retroreflectivity standards

The City now has an accurate and detailed regulatory street sign GIS layer that they can use to prioritize the replacement of street signs that don't meet retroreflectivity standards or are in poor condition.

A related table was created for maintenance tracking. Collector is used in the field to update each sign's condition, date maintenance was performed, etc.

Web maps can be used to view locations and types of signs as well as condition so maintenance expenses can be planned over multiple fiscal years. 


Need help with the setup and/or collection of a street sign inventory? Contact Interwest GIS at: http://www.interwestgrp.com/serv-gis.php  

Monday, February 6, 2017

Storymap Highlights Public Works Projects

The City of Rancho Cordova's Public Works Department wanted to showcase to residents the various projects the City was working on. 

Interwest provides GIS Services to the City and was asked to create a map board which depicts various public works projects along with a description, status, a site photo, and funding source(s) for the City's State of the City event in November 2015. 


November 2015 Map Board

The map board was a big success and it was decided that it should be updated annually each year at the State of the City. 

November 2016 Map Board

Knowing this information would work well in a digital format as a story map, in early 2016 a plan was enacted to create a story map with a similar look at feel. A small group of people in the Public Works Department came together to coordinate this project.

The primary goal is to identify some of the many projects managed through the City's Capital Improvement Plan and Community Enhancement Fund (CEF). The application includes projects at various stages of progress from planning through construction and completion as well as ongoing projects, and for each it provides the project name, a brief description, a representative photo, as well as the funding sources, and contact information where you can learn more. 

Story Map 2016

The challenge was to gather all the necessary information on up to 50 projects managed various project managers in the department. In order to do this a MS Excel spreadsheet with all the projects was setup, providing project managers a familiar way to update the details of their projects. This table was linked into MS Access which also made the data available to GIS applications. Once the updates were complete, the GIS staff used model builder to join the table and populate a GIS layer for the tour points which could then simply be exported to a CSV file for easy uploading to ArcGIS Online.

Model Builder

Updates to this application are planned quarterly as time permits (January, April, July, and October) at which time old projects can removed, existing projects can be updated, and new projects can be added. Check it out at: http://arcg.is/2j1wI1Q 


For general questions regarding the projects in this story map please contact Rancho Cordova PublicWorks at (916) 851-8710.

For help, more information, or to report problems with this application please contact Brad Findlay, GIS Analyst at bfindlay@cityofranchocordova.org

Monday, January 30, 2017

Mailing Labels for Owners, Occupants and Neighborhood Groups

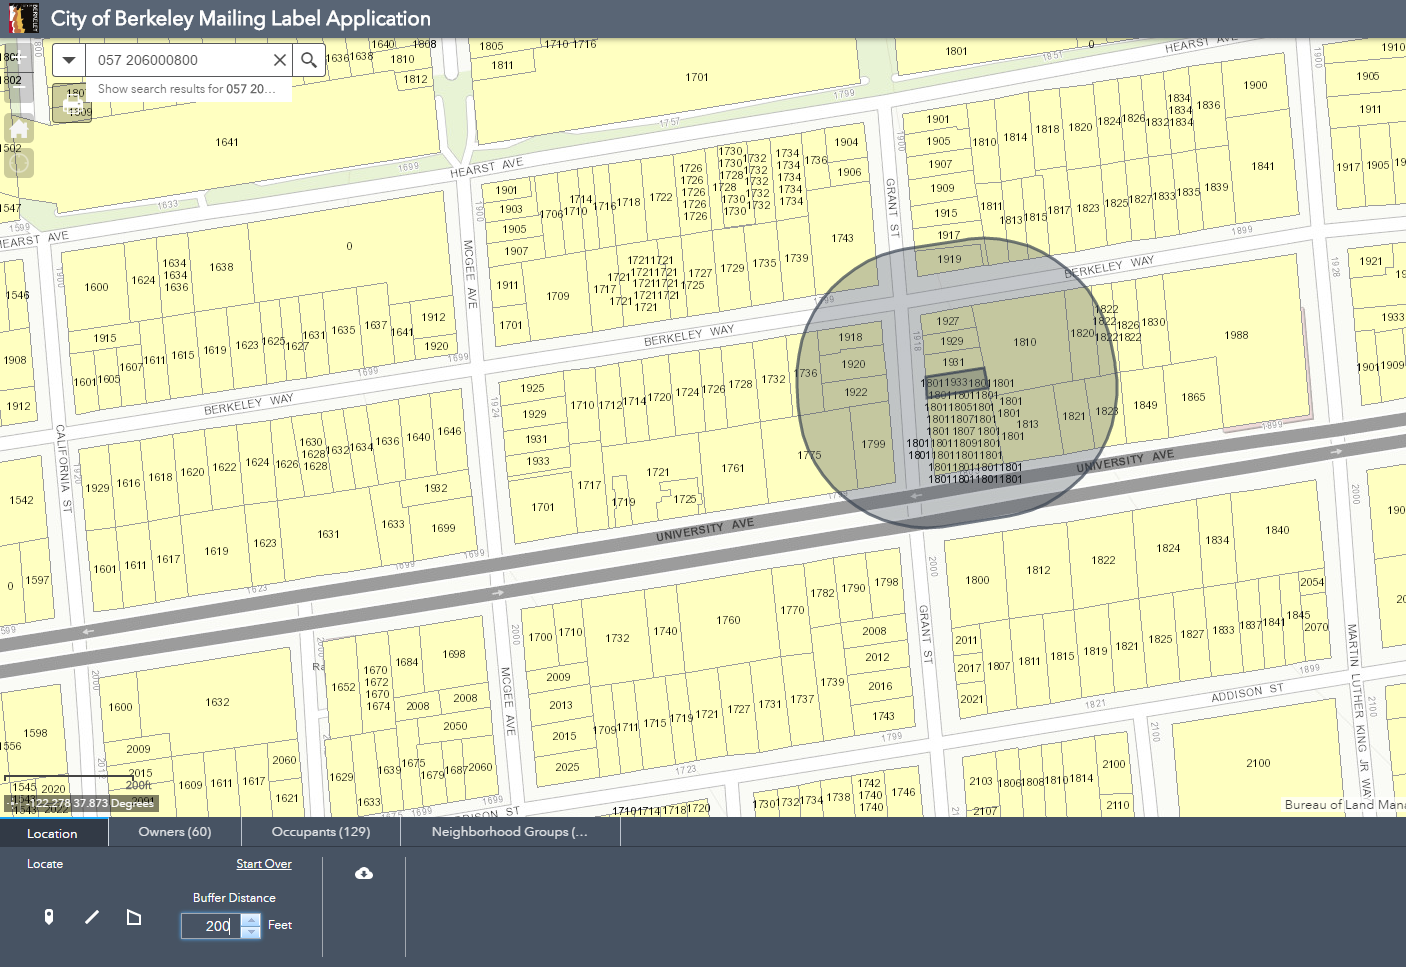
The City of Berkeley was in need of a mailing label application that could export lists of addresses based on a buffer around a parcel, point, or line.

The City required mailing labels for the following: 

1. Owners: A query layer was used to combine the two parcel layers into one Owners layer: one for parcels inside the city and one for parcels within a half mile of the city boundary.

2. Occupants: A query layer was used to join the point layer of occupants with the parcel layer to create one parcel layer allowing all occupants of a single parcel to be selected when the parcel is selected.

3. Neighborhood Groups

Interwest utilized Esri's Web AppBuilder to create the application in the City's ArcGIS Online Account.

The users can search for the APN, Situs Address, or Neighborhood Group name.


The search locates and selects the parcel:


The Situation Awareness widget was utilized to provide the buffer and export. Initial the buffer, input the # of feet to buffer around the parcel and the buffer will draw on the map.


Click the Owner, Occupants, or Neighborhood Groups tabs to view the selected parcels and download the csv file.


The tool can also be used to drop a point, draw a line, or draw a polygon to select the owners, occupants, and neighborhood groups. 


Need assistance creating a mailing label application for your agency? Connect with us at: http://www.interwestgrp.com/serv-gis.php 

Tuesday, January 10, 2017

Location Analysis

With the passing of Proposition 64, many cities need to provide their council and citizens with information on where they could potentially open a marijuana dispensary.

City of Ukiah staff needed to provide their city council with options on where dispensaries could be located that would meet the location requirements including:

  • 600ft distance from schools
  • Distance from youth facilities (250ft or 500ft) 
  • Zoning 
In addition to the static maps for City Council, an interactive web app was created using Esri's web app builder. The web app allows the planning committee to review the locations, owners, and see summaries at two different distances from youth facilities.


Need help with a GIS location project? Connect with us at: http://www.interwestgrp.com/serv-gis.php 

Wednesday, November 30, 2016

Interwest presenting at the Seventh Annual Los Angeles Geospatial Summit

Interwest GIS Analyst Mallory Graves will be speaking at the Seventh Annual Los Angeles Geospatial Summit in February. Come check out her presentation:

Date: 2.24.17
Location: USC Radisson Hotel
Presentation: Engaging Communities in Environmental Cleanups using a Web GIS Story Map
Conference Details: Seventh Annual Los Angeles Geospatial Summit 


Friday, November 18, 2016

Comprehensive Parcel Report

Interwest provides custom reporting services to public agencies. The City of Wildomar needed a quick way to provide the public with information about their property. 

Interwest created a custom JavaScript GIS Viewer for the City. Users were already able to turn on all of the layers they needed, click on a parcel and view parcel details or attributes from other layers.


They needed a quick way to provide a report to citizens or developers with the parcel information as well as info on the property's flood zone, fault zone, community service area, council district, etc. The parcel report does just that and loads in under two seconds. 

Interwest developed a custom web based report that can quickly be saved as a pdf file for printing. The report uses SQL Spatial to compile all the details of the property into one report as well as display a map of the property. 


The report is accessible outside of the viewer as well as from a toolbar on the viewer and from the parcel pop-up for maximum flexibility.

The report also provides links to the County's assessor maps and subdivision tract maps. 


Contact us if our GIS Team can help you with your custom reporting needs! 

Wednesday, November 16, 2016

Transit Demand Model

Interwest GIS provides transit demand modeling for public agencies. For Shasta Regional Transportation Agency (SRTA), Interwest used the ArcGIS-integrated planning tool called Transit Boarding and Estimation Simulation Tool (TBEST).

Examining Ridership 
The validated model is visual and interactive, with tools for examining ridership forecasts based on socioeconomic, land use, and transit network builds for the service area.

  • Captures the current socioeconomic and land use conditions for a service area
  • Codes these conditions within a transit network
  • Determines stop-level ridership
  • User creates scenarios to determine potential impact on future ridership


Ridership Projections 
Intewest GIS used TBEST and GIS to project ridership under different scenarios including:
  • Adding a new Route
  • Re-routing an existing route 
  • Adding Sunday Service
  • Increasing fares


Does your transit agency need assistance with transit modeling? Contact Interwest's GIS team for more details!