Friday, November 11, 2016

Honoring our Heroes: Military Banner Program

The City of Elk Grove launched a Military Street Banner Program honoring veterans who reside in the City or resided in the City and are now deceased. The City designated 75 poles for the program. 

Interwest GIS solved the following needs for the City:  

Provide the contractor installing banners location information
Interwest created a web map of each banner's location to assist the contractor in installing the banners. 


Provide City staff a way to track the installation date of each banner with workflow reminders 
Each banner is installed for a 12 month period after which the banner is removed a new banner is printed and installed in its place. City staff needed a way to track the installation date of the banners with workflow reminders of when a banner needed to be removed so the staff could order the printing of a new banner and schedule the installation. Interwest's GIS Team created a SharePoint list that integrates with the GIS streetlight data to feed the installation map for the contractor and the public map. 

The SharePoint list contains all streetlights. Each evening an SSIS package runs and imports the data from the SharePoint list into an SDE table. A spatial view is used in the map to join the table to the streetlights layer. A script is also run nightly to update the data in ArcGIS Online so the public map is up-to-date. 


Provide the public a way to find the location of their veteran's banner
Until a custom banner has been purchased, banners honoring all veterans are displayed on the poles. A public web app was created to assist the public in searching for and locating their veterans banner. A story map was also created showing the veterans photo, name, branch, and rank.


Thursday, November 10, 2016

Using GIS for Transit Analysis

Interwest provides GIS services to public agencies to analyze route changes and ridership. The City of Elk Grove is conducting a Comprehensive Transit Analysis that will be used to define the future of transit in the City.

Interwest GIS created an interactive web application using Esri's Web AppBuilder to show existing and proposed routes. As part of the analysis, the City's transit team developed a "service plan working paper" that included exhibits showing the recommended service improvements. This web app displays the information in an interactive form that allows the public and council members to review the proposals with more flexibility.

The web map also needed to display the relationship between routes and major employment centers, schools, and hospitals.


Interwest GIS worked with IBI, the City's Transit Consultant, to convert the proposed routes from Adobe Illustrator exhibits into a format that could be published to an ArcGIS Online web map. Special attention was placed on the zoom scale of the application to support the visual requirements of offsetting routes to display multiple features while ensuring it wasn't possible to zoom in far enough for the routes to appear not on the roadway.


Friday, November 4, 2016

Performing Cost Effective Asset Management Inventories Utilizing GIS

Interwest was honored to be selected to speak with the Town of Atherton's Public Works Superintendent Steve Tyler at the APWA Public Works Conference in Richmond. 

Below is a link to the slides from the presentation Mark Dumford and Steve Tyler gave on November 3rd. 


Thursday, October 27, 2016

Open Data and Agency Collaboration

Interwest was honored to be chosen to speak at the 2016 MISAC Conference in San Diego. 

Below is a link to the slides from the presentation Steve Gay, GISP gave on Open Data and Agency Collaboration on Sun, October 9th.


Need help implementing configuring ArcGIS Open Data for your agency? Contact our GIS Team to find out how we can help your agency meet the open data requirements in Assembly Bill 169 Chapter 737.  

Thursday, September 22, 2016

Croudsource Storymap GIS Game

We had a work retreat last weekend in Monterey, CA. 90 families from our Northern California offices gathered for a fun weekend. Terry, the president of our company, suggested our GIS team make a game for the retreat. (yes, actually, we are hiring ;)

Premise of the Game:
Earn points for sharing photos of your trip via a web app accessible on a smart phone


Our team created 5 different applications and tested them out in the field. The options we evaluated included:

  • WebApp Builder 
  • Public Info AGO Template
  • Find, Edit, Filer AGO Template
  • Citizen Report Web App
  • Crowdsource Storymap

We settled on the Crowdsource Storymap, key reasons included:
  • Intuitive, easy to use
  • ability to login from facebook, google, or ArcGIS Online
  • Gallery feature to easily view other employees' photos


Game Logistics:

  1. Point layer of 15 destinations at the Asilomar Conference Grounds and around Monterey 
  2. A second point layer with 3 hidden destinations
  3. A leaderboard webpage to display
    1. The top 10 point earners
    2. Clues for the 3 hidden stops
    3. Once someone found a hidden stop, display the username and date/time it was found 
    4. Link to launch the game
  4. Employees were set loose with their phones and a link to the leaderboard  
  5. A script ran every 15 minutes to download the crowdsource layer from ArcGIS Online to our SQL Server, give points based on proximity to the 15 destinations or 3 hidden destinations, verify the user did not already get a point for this location, and update a table with each users' point total. 

At the end of the game, we downloaded the photos and shared them at a slideshow during the Saturday evening dinner where the top three point earners won prizes. An extra prize was added for the funniest selfie with Terry!

Our Southern California offices are gathering for a retreat in one week in San Diego. We are working on a new dataset for their retreat and a fun new point scheme!

Check out the Crowdsource Storymap and let us know if we can help create a game for your next team building event! 


Tuesday, May 31, 2016

Using GIS to achieve ADA Title II Self Evaluation & Transition Plan Compliance

Interwest provides GIS services to public agencies to assist with the Americans with Disabilities Act’s (ADA) Title II Self Evaluation and Transition Plan requirements for agencies with 50 or more employees. The goal of this project was to perform a self evaluation of the City of Ceres’ programs, services, and public right-of-way and develop a transition plan for the City to ensure compliance with the ADA.  

ROLE OF GIS


GIS created a tool to assist the City of Ceres in automating the collection and monitoring of facilities and curb ramps.

DATA CREATION

The GIS Team acquired data from Stanislaus County, used existing City data and digitized new data needed to develop basemaps and for running the ranking analysis on the ramps. Our team created a data model to capture physical attributes and images of the ramps, published the data to the City’s ArcGIS Online account, and created web maps to be used for curb ramp collection in Collector for ArcGIS. 

Interwest GIS worked with the City to develop ranking criteria based on location and physical properties identified during collection to assist in mapping the curb ramps by priority. 


FIELD ASSESSMENT

Interwest provided a team of two field personnel who collected images and attributes in Collector on iPad minis. The assessment was completed in three weeks. 

After the field inspection phase was complete, the GIS team worked with engineers implement the ranking criteria. For example, ramps in high traffic locations with excessive slopes or concrete displacement would receive a high priority rank.


MONITORING AND PLANNING 

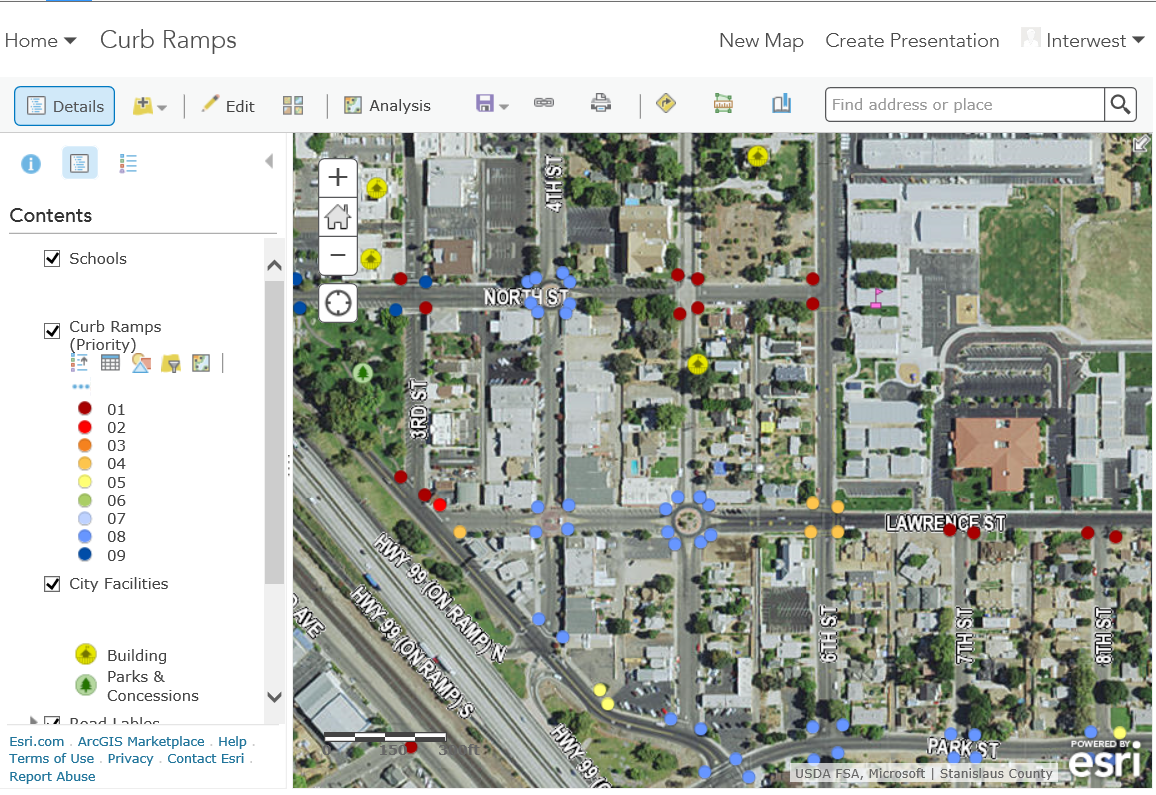
After all the rankings were determined, Interwest GIS created an overall city map displaying the curb ramps ranking and published it to the City’s ArcGIS Online account for viewing by City staff. 

City staff can use the data and map to monitor, plan, and track improvement of the curb ramps withing the City. 


Need help developing your agency's ADA self evaluation and transition plan? Contact Interwest's GIS Team for more details! 

Thursday, May 26, 2016

Historic Sites Story Map

Interwest's GIS Team recently created an Historic Sites Story Map for the City of Ukiah to highlight images, history and provide a spatial reference for citizens and tourists to visit the sites.


Story maps are a great way to showcase your agency's assets. Story maps can also be turned into mobile applications using AppStudio to give wider access to public art, historic sites, and tourist attractions.

Need help telling your city's story with a Story Map? Contact Interwest's GIS Team to learn more.