Showing posts with label smart community. Show all posts

Monday, June 5, 2017

Crime Viewer

The City of Rancho Palos Verdes wanted to provide a crime viewer tool for the public to access both current and historical crime data.

Interwest GIS created a GIS Viewer using Latitude Geographics Geocortex software. Our team created automated routines to download the data from the County's website, import it into the GIS database, and created query layers to merge specific crime codes into broader categories.


The GIS Viewer displays the crime by year and by type allowing citizens to turn on and off layers to focus on the specific types of crime and date range that concerns them.

The public can download the crime data to a csv file if desired and utilize the time slider tool to view the crime in their area chronologically.


The Crime Viewer also has a comprehensive report where the public can view where crime has increased or decreased by category from 2005 - present.

Need assistance created a crime viewer for your citizens? Contact Interwest GIS to discuss your project. 


Fire Run Book

The City of Vacaville Fire Department contacted Interwest GIS to request an update to their fire run book. 


For this project, Interwest GIS was tasked with creating a new updated version of the City’s Fire Run Books. The city had some base layers and additional data layers were created by Interwest. New or updated layers included: 

  • hydrants
  • fire grid index
  • emergency vehicle access points and routes
  • master address database points
  • water points and lines
  • schools
  • apartments/condos
  • commercial areas
  • industrial areas
  • manufactured parks
  • hospitals 

Using ArcGIS Pro for data editing and ArcMap 10.3 Data Driven Pages, Interwest GIS created a new modern rendition of the City's fire run books. The new and updated data feeding into the run books will serve other uses within the City’s Enterprise GIS System.


Need assistance with fire run map book creation? Contract Interwest GIS to let us know how we can help. 

Operations Dashboard showcasing New Construction Permits

Interwest GIS implemented the Operations Dashboard for the City of Elk Grove to display building permit data. Our team had been creating monthly pdf maps for the City's Building Department and felt the dashboard would be a meaningful way to display both an interactive map and graphs showing the number of residential and commercial permits per month.


A model was created to join the permit data to the parcel data to display in the map and graphs.

In addition to giving a snapshot overview of permit activity, the interactive map allows citizens and staff to click on area and get more information about the permit.

An Operations Dashboard is a great way to display graphs and maps to monitor activities such as building permits or maintenance requests. Need help implementing Operations Dashboard for ArcGIS? Contact Interwest GIS for more information.

Monday, March 27, 2017

Regulatory Street Sign Inventory

The City of St. Helena needed to conduct a regulatory street sign inventory to comply with recent changes to the California Manual on Uniform Traffic Control Devices (MUTCD) standards for retroreflectivity. 

The City had previously conducted a paper survey of approximately 1/3 of the regulatory street signs. Interwest GIS created a GIS layer using the paper surveys and Google Street view to identify the locations of regulatory signs.

Interwest GIS utilized Collector of ArcGIS during over two days in the field to verify the location and capture data for the City's 609 regulatory signs:
  • MUTCD code
  • sign condition
  • whether the signs met retroreflectivity standards
  • post material
  • sign size
  • sign direction
  • sign text
  • and capture photos of signs that did not meet retroreflectivity standards

The City now has an accurate and detailed regulatory street sign GIS layer that they can use to prioritize the replacement of street signs that don't meet retroreflectivity standards or are in poor condition.

A related table was created for maintenance tracking. Collector is used in the field to update each sign's condition, date maintenance was performed, etc.

Web maps can be used to view locations and types of signs as well as condition so maintenance expenses can be planned over multiple fiscal years. 


Need help with the setup and/or collection of a street sign inventory? Contact Interwest GIS at: http://www.interwestgrp.com/serv-gis.php  

Tuesday, January 10, 2017

Location Analysis

With the passing of Proposition 64, many cities need to provide their council and citizens with information on where they could potentially open a marijuana dispensary.

City of Ukiah staff needed to provide their city council with options on where dispensaries could be located that would meet the location requirements including:

  • 600ft distance from schools
  • Distance from youth facilities (250ft or 500ft) 
  • Zoning 
In addition to the static maps for City Council, an interactive web app was created using Esri's web app builder. The web app allows the planning committee to review the locations, owners, and see summaries at two different distances from youth facilities.


Need help with a GIS location project? Connect with us at: http://www.interwestgrp.com/serv-gis.php 

Friday, November 18, 2016

Comprehensive Parcel Report

Interwest provides custom reporting services to public agencies. The City of Wildomar needed a quick way to provide the public with information about their property. 

Interwest created a custom JavaScript GIS Viewer for the City. Users were already able to turn on all of the layers they needed, click on a parcel and view parcel details or attributes from other layers.


They needed a quick way to provide a report to citizens or developers with the parcel information as well as info on the property's flood zone, fault zone, community service area, council district, etc. The parcel report does just that and loads in under two seconds. 

Interwest developed a custom web based report that can quickly be saved as a pdf file for printing. The report uses SQL Spatial to compile all the details of the property into one report as well as display a map of the property. 


The report is accessible outside of the viewer as well as from a toolbar on the viewer and from the parcel pop-up for maximum flexibility.

The report also provides links to the County's assessor maps and subdivision tract maps. 


Contact us if our GIS Team can help you with your custom reporting needs! 

Tuesday, May 31, 2016

Using GIS to achieve ADA Title II Self Evaluation & Transition Plan Compliance

Interwest provides GIS services to public agencies to assist with the Americans with Disabilities Act’s (ADA) Title II Self Evaluation and Transition Plan requirements for agencies with 50 or more employees. The goal of this project was to perform a self evaluation of the City of Ceres’ programs, services, and public right-of-way and develop a transition plan for the City to ensure compliance with the ADA.  

ROLE OF GIS


GIS created a tool to assist the City of Ceres in automating the collection and monitoring of facilities and curb ramps.

DATA CREATION

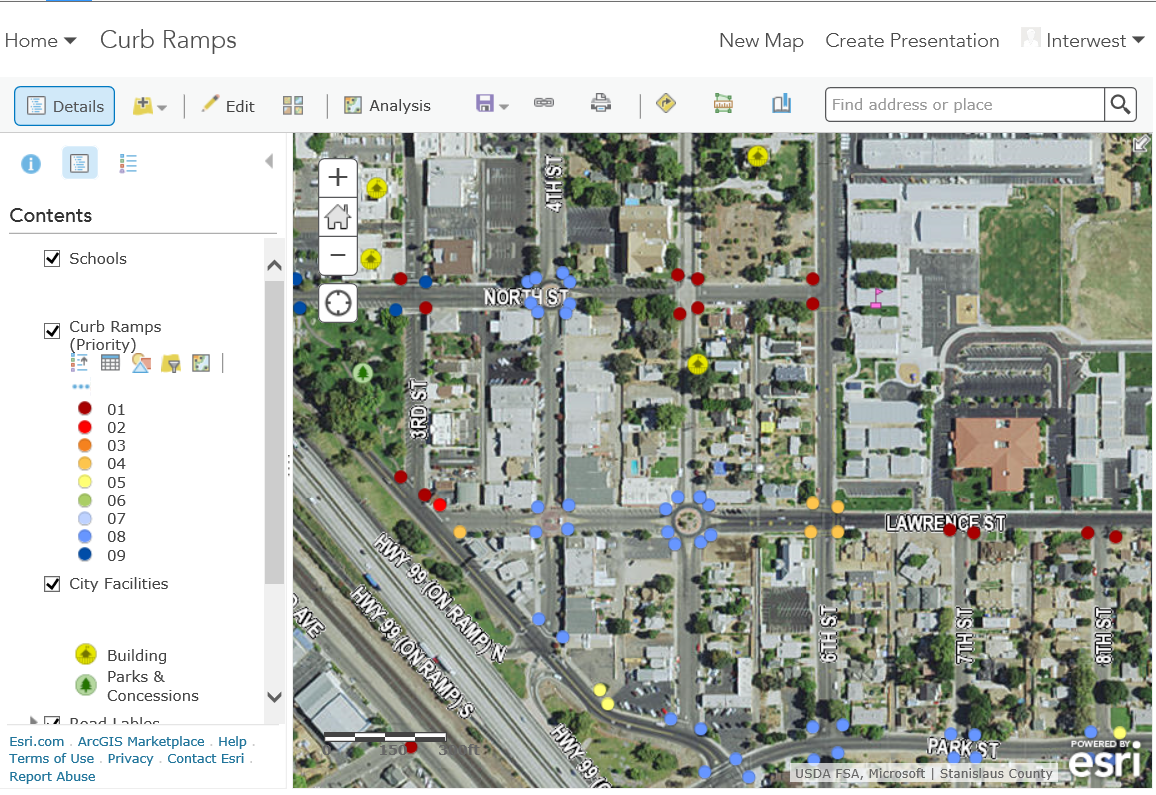
The GIS Team acquired data from Stanislaus County, used existing City data and digitized new data needed to develop basemaps and for running the ranking analysis on the ramps. Our team created a data model to capture physical attributes and images of the ramps, published the data to the City’s ArcGIS Online account, and created web maps to be used for curb ramp collection in Collector for ArcGIS. 

Interwest GIS worked with the City to develop ranking criteria based on location and physical properties identified during collection to assist in mapping the curb ramps by priority. 


FIELD ASSESSMENT

Interwest provided a team of two field personnel who collected images and attributes in Collector on iPad minis. The assessment was completed in three weeks. 

After the field inspection phase was complete, the GIS team worked with engineers implement the ranking criteria. For example, ramps in high traffic locations with excessive slopes or concrete displacement would receive a high priority rank.


MONITORING AND PLANNING 

After all the rankings were determined, Interwest GIS created an overall city map displaying the curb ramps ranking and published it to the City’s ArcGIS Online account for viewing by City staff. 

City staff can use the data and map to monitor, plan, and track improvement of the curb ramps withing the City. 


Need help developing your agency's ADA self evaluation and transition plan? Contact Interwest's GIS Team for more details! 

Monday, May 11, 2015

Weed Abatement for Fire Prevention Using GIS

Every year the City of Merced's Fire Department conducts a weed abatement survey to identify and locate areas where weed over-growth can cause a potential fire hazard.  

Residents are required to maintain their properties year round by removing weeds as well as other combustible debris such as junk wood, dead trees, and dead brush. Adherence to the ordinance is critical during the dry season.

Interwest partnered with the City’s GIS department to quickly develop a web based inspection application to help track all the information tied to the weed abatement survey. 

Read more here: http://www.mercedsunstar.com/news/local/article3259195.html#storylink=cpy


The GIS application helped the city gather the information in just a few weeks, allowing staff to analyze the data and work with citizens on mitigating the potential fire hazards.

Interested in having Interwest's GIS Solutions team create a web application for your agency?  Contact the GIS Team to get started. 

Thursday, May 7, 2015

Drought Response and Water Conservation with GIS

The City of Elk Grove's citizens are served by multiple water purveyors. Each agency is responsible for determining rationing and restrictions of its customers as California faces the most severe drought in recorded history. The City created a web page to help citizens determine which agency services their home and their home's permitted watering days and times. 

Interwest's GIS team assisted this effort by creating a web map for citizens to determine which agency services their home.


In addition to the webmap, Interwest created a widget for the webpage that allows a citizen to look up their address and determine their watering restrictions. Addresses auto-fill as the citizen types, the citizen selects the appropriate address and searches.


The widget accesses the rest end point of the ArcGIS Online hosted feature service to display restrictions based on the water purveyor servicing that address and the even/odd address number of the parcel.


Interested in having Interwest's GIS Solutions team assist with your agency's drought response efforts?  Contact the GIS Team to get started. 


CSD Demonstrates Storm Water Compliance Using GIS

Cosumnes Community Services District (CSD) needed to create an inventory of drainage inlets to meet California State Water Control Board storm sewer system requirements.

Interwest acquired data, created map products, and a custom webpage to view and edit the data:


  • Data exports acquired from the City of Elk Grove
  • Web map of inlets, pipelines, and outfalls in or near the CSD’s parks and fire stations
  • Field inspections to add inlets within the District’s parks
  • Custom webpage to display the inlet details and images


The data creation process included starting with the infrastructure provided by the City of Elk Grove, removing inlets, pipeline and outfalls that were not connected to CSD’s parks or firestation, adding new inlets that were within CSD’s properties, and mapping them to their appropriate outfall. Field inspections were conducted using Collector for ArcGIS to add inlets and their related details and photos.


The District is able to demonstrate the flow of storm water from inlet to outfall to the California State Water Control Board for each of their properties, track inspection date, watershed area, ownership information and images to assist with state requirements as well as maintenance efforts. 

The webpage allows staff to edit live data from the rest end point of the hosted feature class; any changes to the inlets on the webpage are available immediately on the map in ArcGIS Online or Collector for ArcGIS. 


Interested in having Interwest's GIS Solutions team assist with your agency's State Water Control Board requirements?  Contact the GIS Team to get started.

Monday, April 13, 2015

LED Retrofit Utilizes ArcGIS Platform

Interwest provides GIS services to local government agencies to assist in field collection and citizen communication. The goal of this project was to provide field collection tools for staff converting streetlights to LED and a communication tool to share the progress with citizens in the City of Elk Grove.  The City was already using ArcGIS Online as a platform to collaborate with GIS and other data so this tool was the natural solution to support the LED retrofit.

FIELD INSPECTIONS 

To ensure accurate cost estimates an inventory of all lights was conducted using Collector for ArcGIS.  Missing lights were added, retired lights were removed and the description of light types was updated.  This data was exported for inclusion in the Request For Proposals.  Once the project was under way the installation contractor also utilized Collector to track the date each light was modified.  The view of the data for field crews was limited to just the attributes they needed to modify. 


COMMUNICATION

Project mangers were able to review the data for lights as they were replaced. They could inspect and accept each light as appropriate.  A very streamlined webmap application was created to show the public the status of lights as they were completed.   


KEY BENEFITS

Ease of use  -  Installation crews received one hour of  introductory training.  They modified GIS data for over 10,000 streetlights and did not request technical assistance at all throughout the process.

Up-to-the-minute data – Utilizing a platform that is accessible to all stakeholders allowed the data being captured in the field to be accessible to project mangers and citizens immediately.  
Centrally tracked data eliminated the situation of data inconsistency that often occurs when multiple copies of data is stored.
A grid showing the scheduled dates for installation showed citizens when to expect work in their neighborhood. The exact installation status of each light displayed the specific progress on each street.
The billing process was very efficient enabling staff to authorize payment on exactly the lights that were installed – per the vendors field data entry.

Speed of system deployment - A sample version of the database was created and accessible to the field crews in less than a week.
Most changes that were requested during the project were able to be accomplished immediately with no disruption to the field crews workflow.

BEFORE & AFTER
Images available on the City's website.

Monday, October 6, 2014

Rental Inspection Field Collection with GIS

Interwest's GIS Team worked with the The City of Covina to conduct an initial cursory review from the public right of way of over 1300 properties registered in the Rental Housing Inspection Program. The City was looking for violations of city and community standards. Interwest’s field inspectors collected data and took photographs with iPads. The field collection directly uploaded into a customized tracking system compatible with the City’s current GIS system.


Interwest’s field collection staff utilized the Collector app to record their findings and ArcGIS Online web maps were created to provide a visual representation of the field collection work so City staff could monitor the progress and analyze the outcomes of the rental inspections.


Interwest worked with the City to develop a community based program for sustaining rental housing standards. The City of Covina received a Helen Putnam Award for Excellence in Internal Administration for the innovative solution.

After the field inspection, Interwest worked with the City's GIS Technician James Knox, to migrate the data and web maps from Interwest's ArcGIS Server to the City's on premise ArcGIS Server.


Steve Gay, James Knox, and Mark Dumford

Interested in having Interwest's GIS Solutions team design and implement a rental inspection program for your organization?  Contact the GIS Team to get started.


Tuesday, June 24, 2014

Parks and Rec Finder Application

Interwest's GIS Team implemented a Park and Rec Finder application for the Cosumnes Community Services District last week using Esri's javascript template.


The application allows citizens to search for parks near an address, by park name, or by park amenities such as baseball or waterplay.  The app displays all the amenities you can find at the selected park, allows you to switch between all parks that have the amenity you searched for, displays park images and routing from your current location to the park.  


Interested in having Interwest's GIS Solutions team create a custom park finder application for your organization?  Contact the GIS Team to get started.

Thursday, February 14, 2013

GIS ADA Compliance Curb Ramp Project


Interwest’s GIS Team created an ArcGIS Online application that was used in the field to collect individual curb ramp location attribute information.  The goal of the project was to create an improvement plan for the City of Bell to repair curb ramps over several fiscal years depending on priority. The plan was used to help the city with its Americans with Disabilities Act (ADA) Compliance efforts.

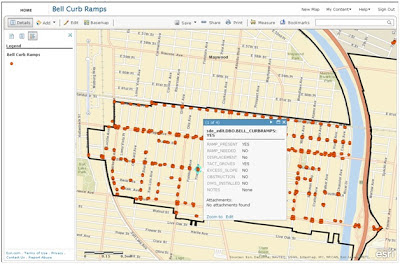
The GIS team met with City of Bell staff to determine a list of attributes required for the project, created a shell geodatabase with these attributes in ArcGIS Server to facilitate direct live edits into the city production data set, and brought the geodatabases together with aerial photos provided by Esri’s Bing Basemaps.  The GIS team systematically reviewed the entire city, creating a point location for each curb ramp, then created an ArcGIS Online application to be used in the field for data collection.


A field inspector visited each location and updated the condition of the curb ramps using ArcGIS Online on a 3G enabled Apple iPad.  These updates were available in real time to GIS staff at the office.
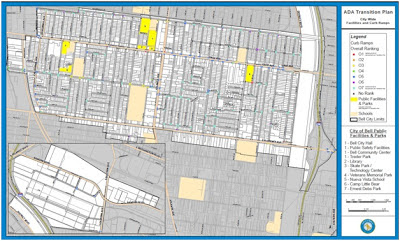
After the data collection phase was complete, the GIS team worked with project engineers to determine location priorities such as high traffic areas and physical condition of the curb ramp. After all the priorities were determined a Map Series was made to display these priorities and create an improvement plan across several fiscal years.
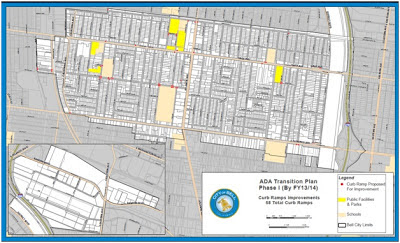


The data was brought into ArcMap to create maps for a public meeting to showcase the city's plans for future ramp improvements.  An ADA Transition plan was created for each fiscal year; additional maps were created to show the public the plans for the current year.


Contact us today to find out how Interwest Consulting Group's GIS Team can help your public agency use GIS in your ADA Compliance efforts.

Sunday, November 11, 2012

Using GIS in Disaster Recovery

When a tornado touched down in SE Elk Grove, CA on October 22nd, Interwest Consulting Group's GIS Team at the City of Elk Grove grabbed their iPads with ArcGIS Online and headed into the field.  Working with the city's Emergency Operations Manager, Building Department and Code Enforcement Staff the team collected damage assessment data.

GIS team members surveyed the damage first hand in the field, inputting the damage location point, and updating custom fields to record the damage type and status of the clean-up efforts.  

Internal version, address removed


Using Esri's ArcGIS Online allowed the team members back at the office to receive live updates of the damage.  

The ArcGIS Online application makes it easy for team members to update the storm clean-up efforts via their phones and tablets in the field as residents begin to rebuild their fences and repair their homes and gardens.


Interested in using GIS on mobile devices in storm management and disaster recovery efforts?  Contact the GIS Team at Interwest Consulting Group to get started: http://www.interwestgrp.com/serv-gis.php 

Sunday, June 24, 2012

Firework Stands in Elk Grove

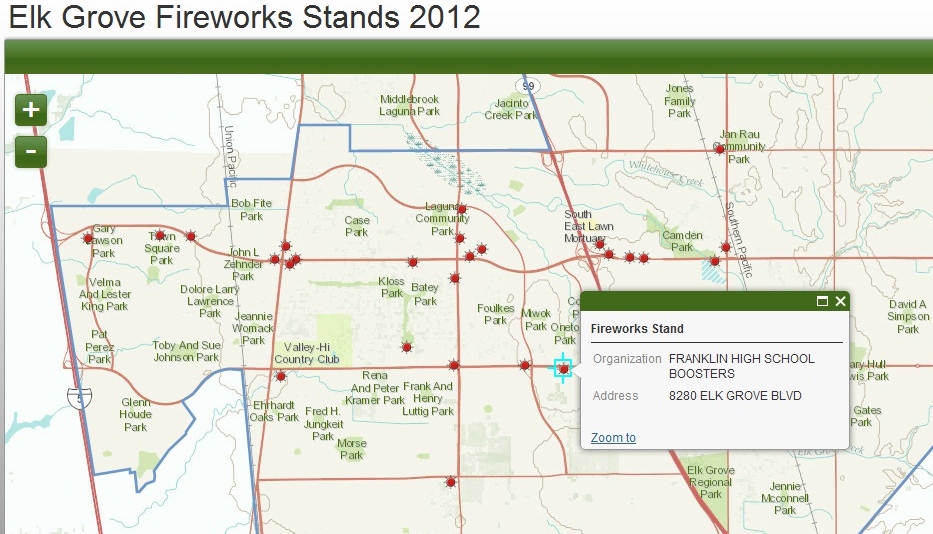
Searching for where to buy fireworks in Elk Grove?  Check out the interactive map Interwest's GIS Team created for the City of Elk Grove using ArcGIS Online.

Click on any Fireworks Stand to view the detailed record including address and host organization.

Interwest is a proud sponsor of the 16th annual Salute to Red, White, and Blue at Elk Grove Regional Park on July 4th. 

View it live at: http://interwestgis.maps.arcgis.com/apps/OnePane/basicviewer/index.html?appid=edef635e2c484dedb85ffc2be174531c